Hidden Leaks in Pipes from Street to House Pollute Waterways
By Anne-Marie Lambert
Belmont has greatly accelerated investigating underground sources of water pollution in the last six months. This good news is tempered by the knowledge that we have 77 miles of sewer pipes and 56 miles of stormwater drains, all old. The average sewer pipe in Belmont is now 83 years old. The average storm drain is 64 years old. Our accountants assume a 60-year useful life for underground pipes.
Figure 1 shows how we got here. Until 1900, Belmont was a farming community served by about 30 miles of roads without sewers or storm drains. In 1907, we bought our first “tar road surfacer.” By 1940, we added 40 more miles of roads for a total of 70 miles. We also installed 55 miles of underground sewers and 25 miles of underground storm drains, including public works projects that buried much of Winn’s Brook and Wellington Brook in underground culverts.
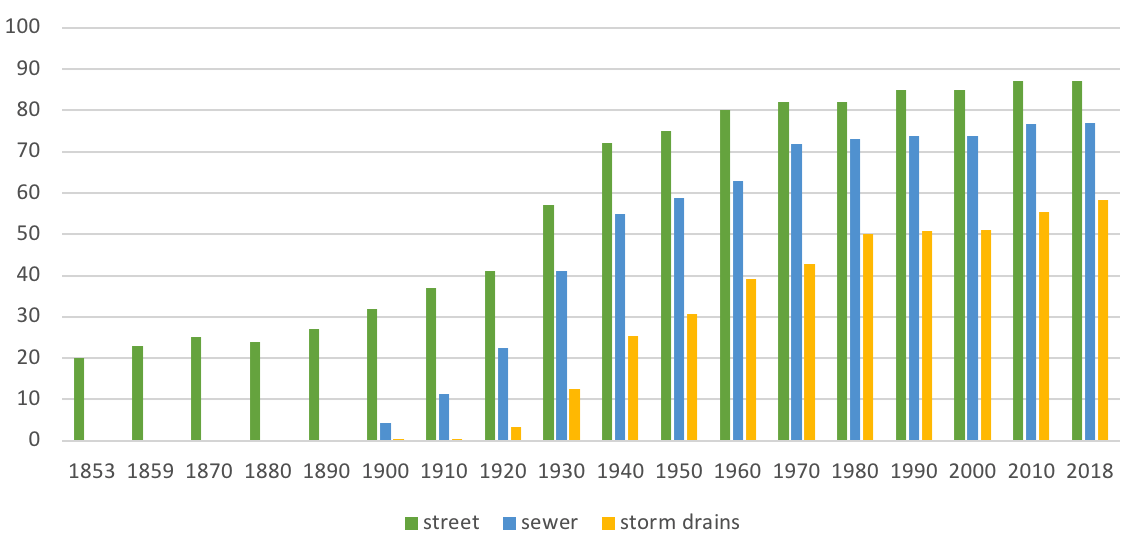
Since 1940, farms have continued to turn into suburbs, but at a slower rate. We’ve added another 47 miles of roads, 22 miles of sewers, and 30 miles of storm drains.
According to Belmont’s December 2017 self-assessment report to the EPA (Environmental Protection Agency), only 52% of the sewer system has been inspected, and only 25% has been rehabilitated or replaced. As of June 2016, the town’s contractor estimated the cost of the backlog of sewer system repairs at $16 million and the stormwater system repairs at an additional $16 million. This estimate was made before the recent round of water quality testing, and it doesn’t take into consideration the repair costs for sewer service laterals—the pipes which connect homes to the street system.
Recent investigations indicate that the most common source of pollution may not be damaged sewer mains and drains under the street, but rather damaged sewer service laterals. Service laterals lie beneath our lawns, where they are sometimes broken by tree roots seeking water and nutrients. Tree roots have less interest in reaching the sewer mains and drains under streets because the soil there has less moisture, fewer nutrients, and is harder to reach.
You never know where you will find a culprit.
Because citizens care more about what they can see than what is hidden underground, the town used to prioritize sewer and stormwater maintenance work under roads with poor surface conditions. About 1.5 miles of sewer and stormwater work continues to be identified per year by that measure. The town is now also prioritizing maintenance based on where the worst pollution has been measured within the drain system. Since July 2017, the town has been busy testing water quality throughout the system. They’ve been doing this in even more locations than required by the EPA’s May 2017 Order on Consent.2
Figure 2 shows the Wellington and Winn’s Brook drainage areas divided into sections.3 As of January 31, months of detective work in 13 miles of storm drains flowing into Winn’s Brook and in 22 miles of drains flowing into the Wellington Brook resulted in the discovery of six suspicious sites in the Wellington or Winn’s Brook drainage areas.
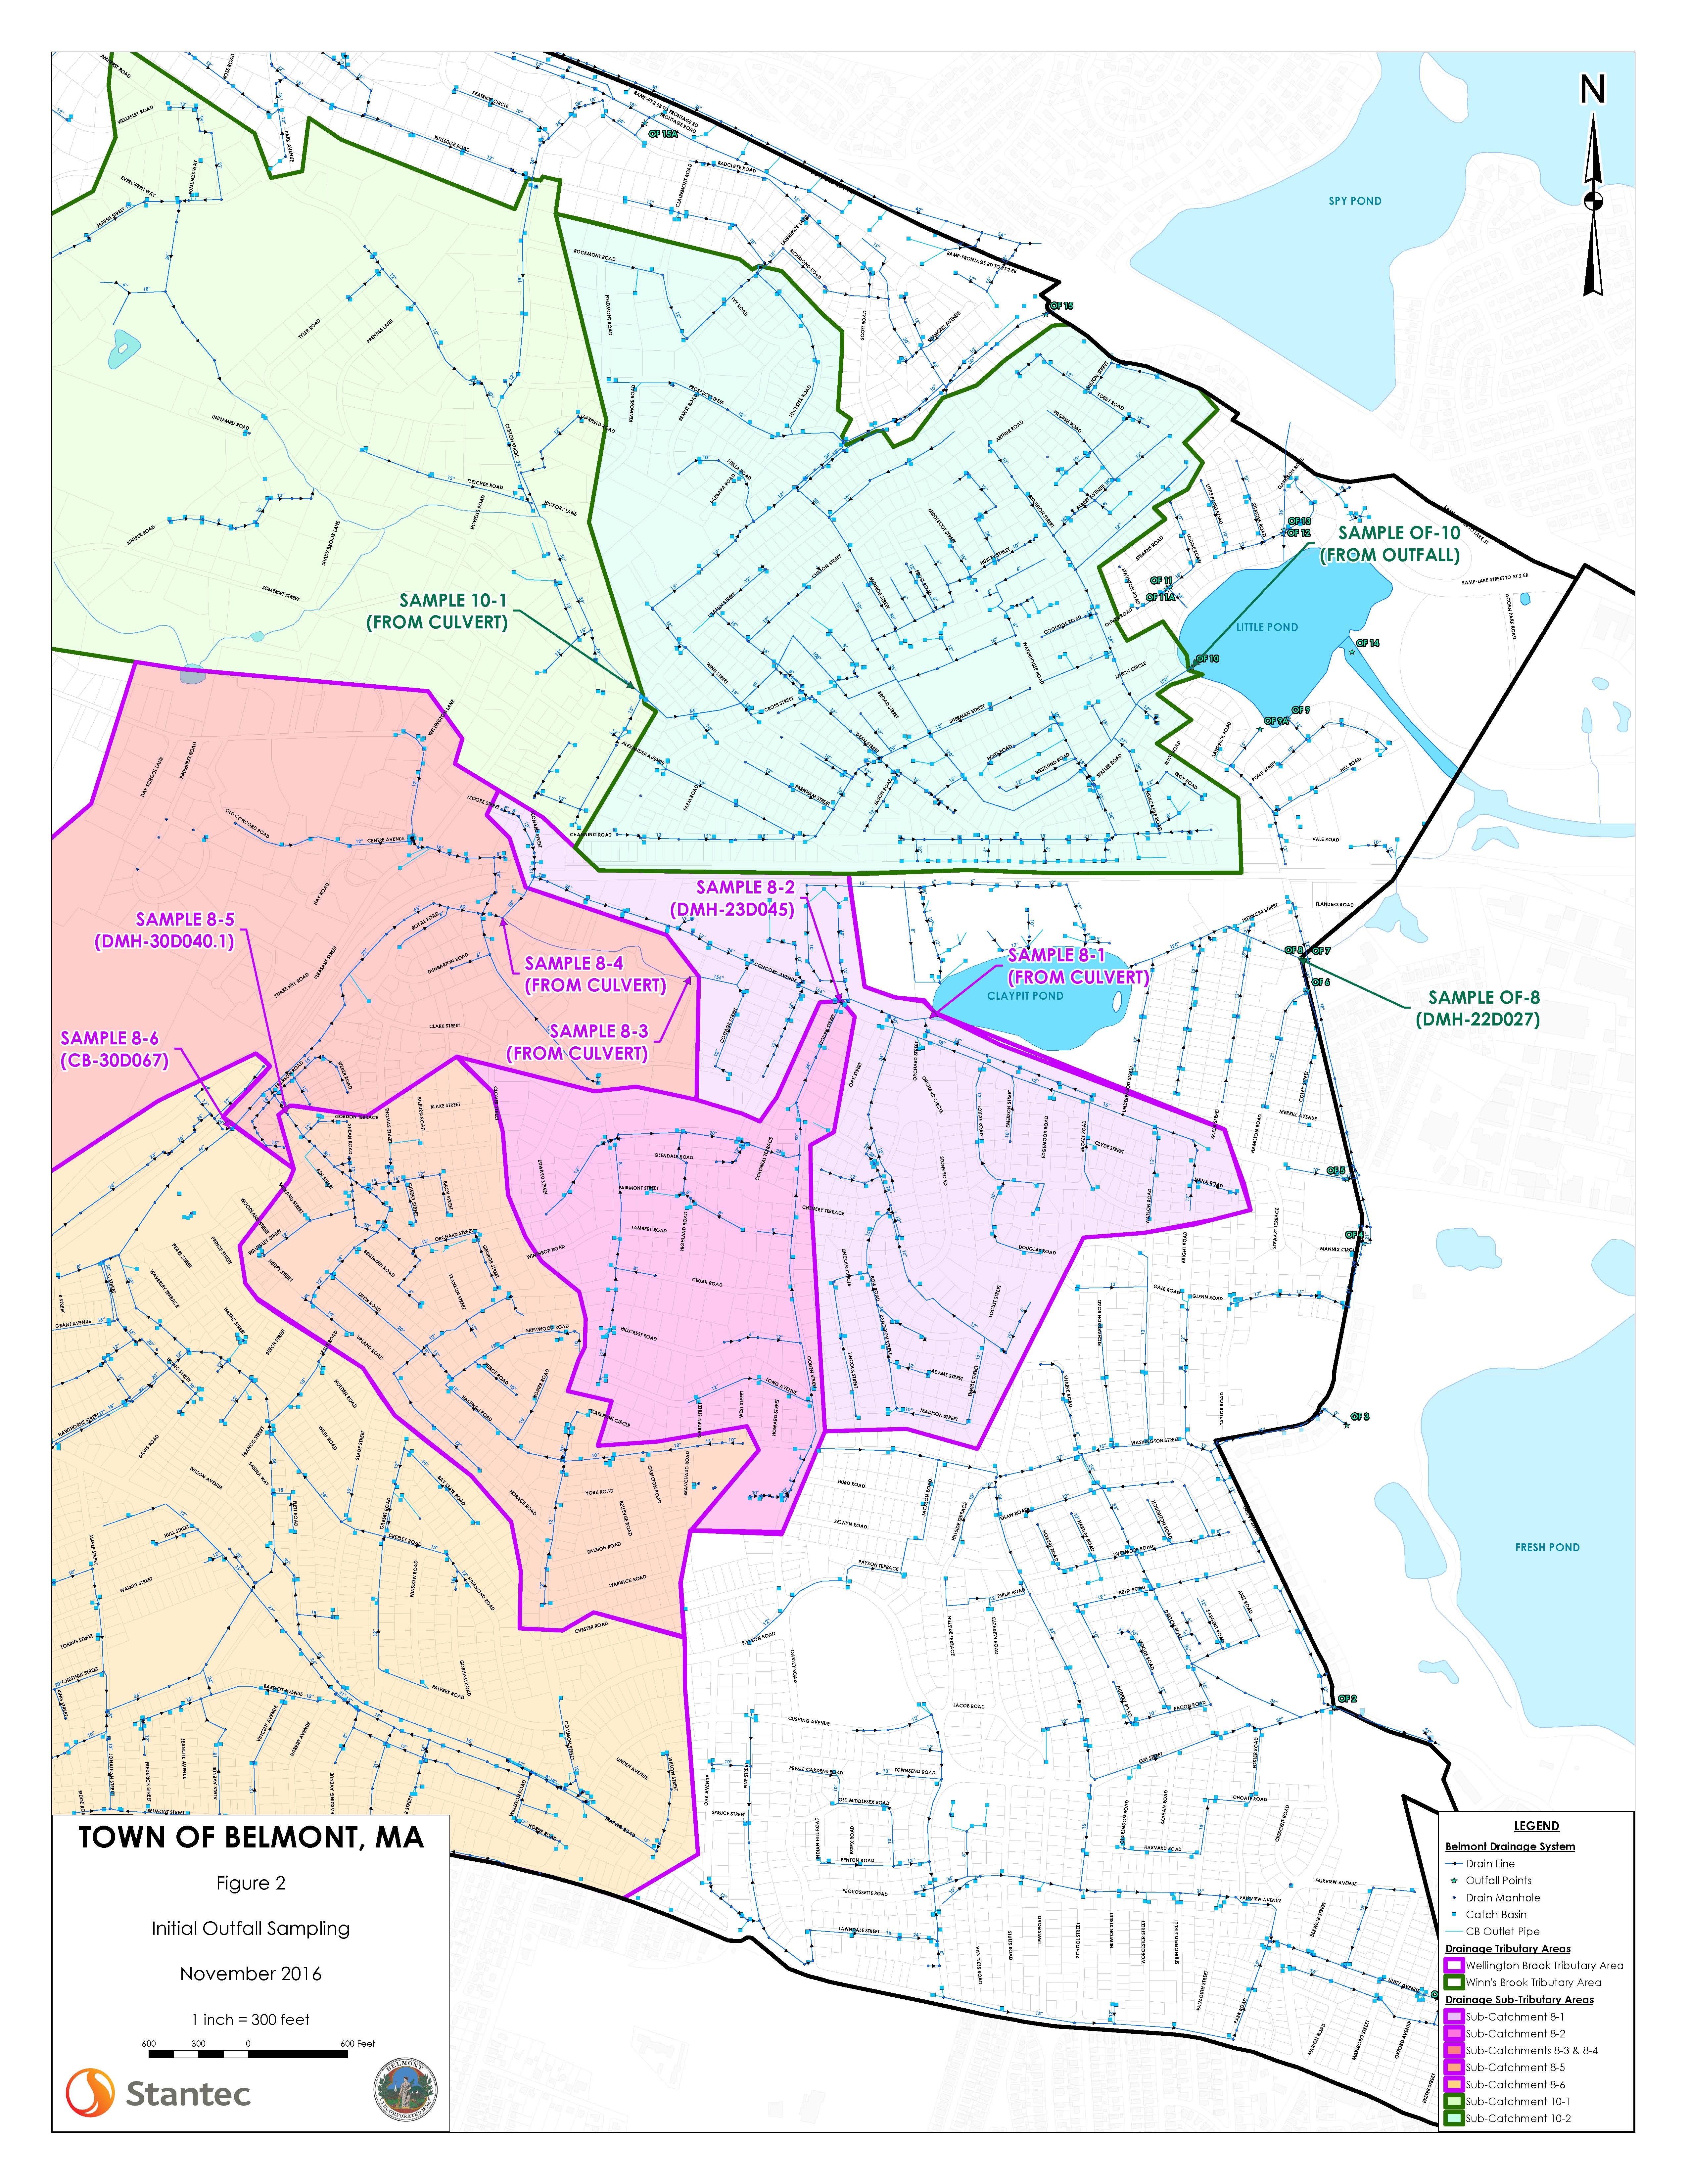
Figure 2: Wellington and Winn’s Brook outfall drainage areas.
Wellington Brook areas are purple; Winn’s Brook areas are green. (Courtesy of the town of Belmont. Prepared by Stantec Consulting Services Inc.)
You never know where you will find a culprit. One location was in the low-lying Winn Brook neighborhood, another near the highest part of Common Street a few blocks from the Beech Street Center. In each location, there was a 1930s-era home with two lateral pipes to the street, one for sewage and one for rain, and indications that sewage was getting into the storm drain.
By January 31, video inspection had been completed in 11 storm drains, 6 sanitary sewer mains, and 27 sewer service laterals in a total of 5 suspect neighborhoods. At press time for this article, the videos had not yet been analyzed. Because of the expense and delays associated with this approach, Glenn Clancy, director of Belmont’s Office of Community Development, is now considering going ahead and lining the service laterals to all homes on a street once dye testing indicates a problem in one service lateral, without investing in video inspections of laterals to every home in a neighborhood.
Town reports to the EPA in November, December, and January reveal detective work still in progress. By April of this year, Clancy hopes to identify and commence a set of small construction projects to fix specific problems. Without exposing exact addresses, here’s the story of what it took to get close to finding one problem in the Winn Brook neighborhood.
Detective story: Where’s the sewage in Winn’s Brook coming from?
November 2016
Divided Winn’s Brook into area 10-1 and 10-2, sampled near the outside of each.
- Identified a strategic point to divide the 13 miles of storm drains into two “catchment areas,” one near Little Pond, and a smaller one farther away. The smaller catchment area (10-1) is upstream of the exposed part of Winn’s Brook just before it goes under Claflin Street.
- Sampled to confirm that the big Winn’s Brook culvert flowing into Little Pond at the end of area 10-2 still has more than 235 cfu/100 ml of E. coli in wet weather. The concentration of E. coli in the culvert was 7,200 cfu/100 ml E. coli in wet weather, remarkable given that the large volume of water in the culvert dilutes any pollution.
- Sampled at Claflin Street: 1,250 cfu/100 ml E. coli in dry weather and 2,700 cfu/100 ml in wet weather; not great.
July 2017
Sampled near periphery of area 10-1, declared it “all clear” for now.
- Sampled at manholes upstream of Claflin Street, e.g., Clifton Street at Pleasant Street, Claflin at Alexander Street: under 500 cfu/100 ml; not too bad.
- Sampled at Claflin Street again. No E. coli detected this time. It’s frustrating that sewage problems can be so intermittent and hard to detect consistently. This type of pollution does not happen when a household is on vacation, for example. Consider all of area 10-1 OK for now; focus instead on the larger catchment area 10-2.
September 2017
Sampled near periphery of area 10-2, identified one really polluted manhole.
- Identified 12 primary manholes in the larger catchment area (10-2) in order to divide it into 12 neighborhoods.
- Sampled at the 12 primary manholes. One of them measured at >20,000 cfu/100 ml. Bingo! Of the others, four are OK (<1000 cfu/100 ml), six are dry or could not be sampled, and one can’t be opened.
- Sampled the Winn’s Brook culvert again. It’s OK this time (200 cfu/100 ml), but that won’t stop us investigating upstream.
October 2017
Sampled upstream of the polluted manhole, identified one really polluted block.
- Sampled in both directions at a manhole upstream of the bad one: one direction is 20,000 cfu/100 ml—bingo! The other direction is OK.
- Sampled at the other 12 secondary and 7 tertiary manholes upstream of the primary manholes. Three are OK, 14 are dry or not sampleable, one can’t be opened, one can’t be accessed.
October 2017
Dye tested in polluted block, found one home with sewage getting into storm drain.
- Sent a letter to each of nine homes in the neighborhood around the polluted manhole warning them that a contractor will be coming to do a 30-minute dye test.
- Sent a contractor and a policeman to knock at the door of each of the nine homes. Three are not home on each of two visits. Six allow entry for a sewer stack inspection and dye test in a basement sink and/or first-floor toilet. One shows evidence of seepage into the downstream storm drain. Bingo!
November 2017–January 2018
Video inspection of part of the Winn Brook neighborhood.
- CCTV video inspections of storm drain and five sewer services to five homes to locate exactly where the service laterals are damaged and to identify any illicit connections.
February–April 2018 (planned)
- Determine exact location and start the 60-day repair clock.
- Review CCTV video to identify specific locations or addresses where wastewater flows into the storm drain. Belmont’s drainage areas comprise about a third of the Alewife sub-watershed, which is a small part of the 80-square-mile Mystic River watershed.
- Depending on the location, determine if town or homeowner is responsible.
- Town: reline or repair broken lateral drains and sewers within 60 days.
- Homeowner: notification sent within 30 days that they have 60 days to address any illicit connection. If not addressed within 90 days, EPA requires town to impose fines.
Future steps
- More sampling to see if these actions stopped the pollution.
- Repeat until sampling shows all is clear!
This detective work is a time-consuming and labor-intensive way to find one leaky drain and get it fixed. During the same months, the town undertook similar detective work in the Wellington Brook catchment area, which is bigger and was divided into five interconnected catchment areas, not just two. There are months of lag time between measurements, and between measurement, detection, and repair.
I was hoping that we could confidently sound the “all clear” one step at a time, starting with peripheral drainage areas with good measurements. Unfortunately, defining “peripheral” is not that straightforward when it comes to drains on a complex topography, and sampling only provides an indicator of where likely problems are, not guarantees. I think the breadth of this approach is impressive, but we need to recognize that any declarations are based on probabilities, not certainties. I am frustrated that it takes so long and that the results are not always definitive.
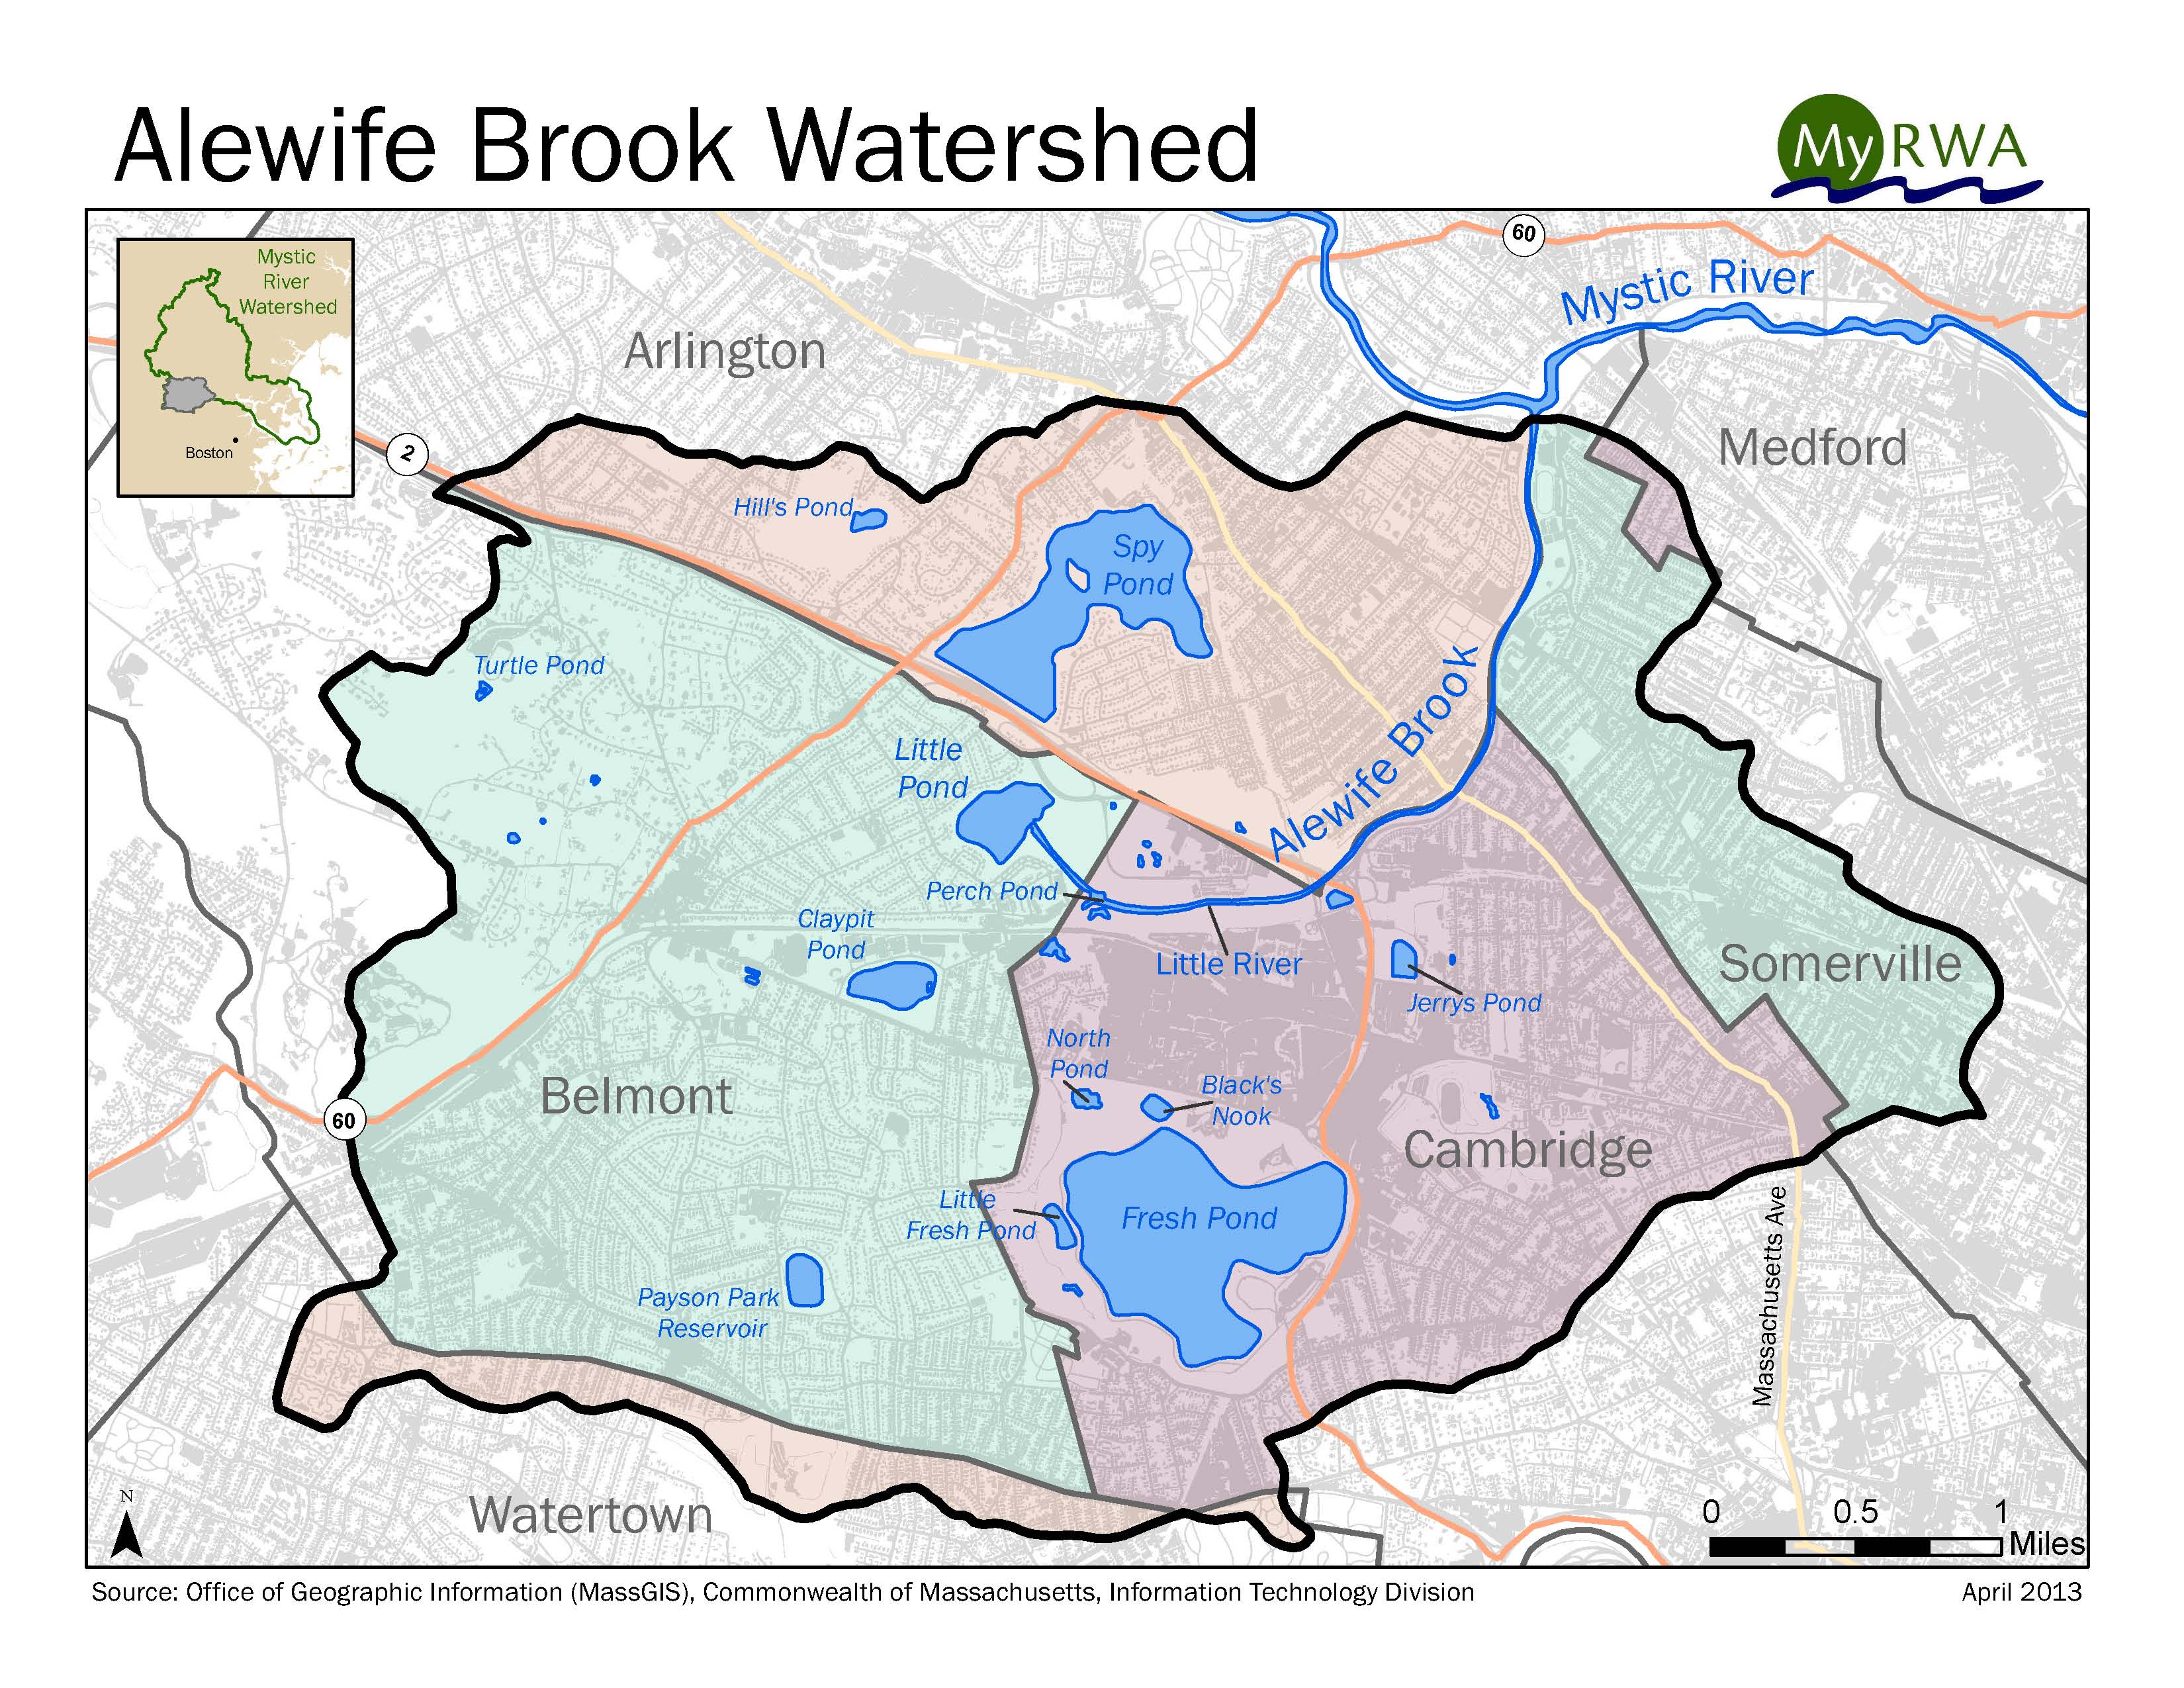
Belmont’s drainage areas comprise about a third of the Alewife sub-watershed, which is a small part of the 80-square-mile Mystic River watershed. (Courtesy of Mystic River Watershed Association, Source: Office of Geographic Information—MASSGIS, Commonwealth of Massachusetts, Information Technology Division, 2013.)
More recently, the town went beyond the EPA requirements and started similar sampling and detective work in all the other areas draining into the Mystic River watershed (outfall areas 1, 2, 9 & 9A, 11, 11A & 12, and 15 & 15A). The Oliver Road area highlighted in the July/August 2017 BCF Newsletter article, “Fix the Stormwater System: It’s the Law,” has now been sampled and inspected with videos; so has the part of the Winn Brook neighborhood pictured in our May/ June 2017 BCF Newsletter article, “Cleaning Up Belmont’s Polluted Waterways.”
As the annual town budget planning gets underway, it feels hard to predict what budget we’ll need to fix the problems we find. The EPA order stipulates action within 60 days once a pollution source is discovered. I wonder if we should do even more investigations simultaneously, and build more room in the budget to recognize the uncertainty surrounding this work. I also continue to wonder whether the town should research and invest in radically different services that use modern sensor and analysis tools.
Educating the Next Generation
Unlike the Belmont farmers and gardeners of yesterday, suburban residents of Belmont today are a lot more interested in what happens in classrooms than in the health of local waterways, which are no longer used for irrigation. When Belmont high school kids leave those classrooms and ask me about water pollution, I start by educating them about where our water bodies are, and about how our water quality is similar to regions without a proper sewage system. I explain that they are growing up in a place where we don’t have water-borne disease only because we expend a lot of energy transporting water from far away and processing it so it’s fit to drink. I try to answer their questions about rain barrels, and help them imagine a future when kids are learning and boating and swimming in our own ponds and brooks.4 I help them envision future town engineers with their robot assistants responding promptly to electronic notifications on the rare occasions pollution is detected in the underground storm drains.
Showing Citizen Interest
With the EPA’s help, our town is accelerating the search for pollution sources, a complicated challenge which doesn’t have a big constituency of engaged citizens. To learn more about next year’s plans for fixing the sewer system, check the town calendar and attend the annual meeting in late March or early April, when the Board of Selectmen sets the water and sewer rates. You’ll learn how Belmont plans to invest the next $500,000 in annual capital expenditures to fix sewer and stormwater drains polluting our waterways. The EPA’s 2022 deadline for finding and addressing all the problems affecting Belmont’s water quality provides a great focus for elected officials. Local citizens demonstrating interest by showing up, or by writing letters of concern, can be equally powerful.
Anne-Marie Lambert is a director of the Belmont Citizens Forum.
What are Belmont’s waterways?
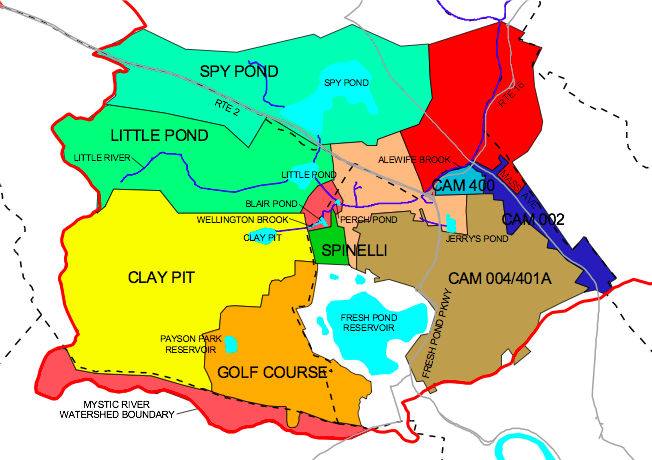
Rain falling on Belmont flows through the town’s municipal system of underground drains into the following surface waters: Little Pond, Clay Pit Pond, Mill Pond, Duck Pond, Wellington Brook, Winn’s Brook, Beaver Brook, and unnamed tributaries to Spy Pond, Blair Pond, and other locations.
Spy Pond drains to Little Pond. Wellington Brook, Winn’s Brook, Little Pond, Clay Pit Pond, and Blair Pond are all tributaries to Little River, which is in turn a tributary to Alewife Brook.
Alewife Brook drains to the Mystic River, which drains to Boston Harbor and then into Massachusetts Bay.
The 1972 Clean Water Act gives the EPA authority to permit municipal systems and to take actions like the 2017 Order on Consent with Belmont in order to ensure the country’s navigable waters are clean. The next level of action would be an Administrative Order.
How many bugs are in our waterways?
Researchers count bacteria in the water as “cfu/100 ml,” or colony-forming units per 100 milliliters. It’s an estimate of how many viable cells there are in 100 ml, which is a little more than four ounces or a half-cup of water.
The Commonwealth of Massachusetts has fresh water standards of 235 and 1,260 cfu of E. coli per 100 ml of water as acceptable levels for swimming and boating, respectively.
“Alewife History, Modelling, and Adaptation” presentation to the Mystic River Watershed Association Joint Committees for Policy and Outreach, Kathryn F. Watkins and Owen O’Riordon, City of Cambridge Department of Public Works, March 6, 2018.
Footnotes
1. Richard Betts, Streets of Belmont and Town of Belmont Capacity, Management, Operations, and Maintenance (CMOM) Program Self-Assessment—CWA-AO-R01-FY17-11 , December 13, 2017.
2. For more about the EPA Order on Consent, see “Fix the Stormwater System: It’s the Law,” July/August 2017 BCF Newsletter , http://www.belmontcitizensforum. org/2017/07/10/fix-the-stormwater-system-its-the-law/
3. Figure 2, Initial Outfall Sampling, from Illicit Discharge Detection and Elimination Program Investigation of the Winn’s Brook and Wellington Brook Tributary Areas, November 1, 2017. Prepared for the Town of Belmont by Stantec Consulting Services Inc.
4. “Daylighting Streams Improves Water, Life,” May/ June 2011 BCF Newsletter, http://www.belmontcitizensforum. org/wp-content/uploads/2011/09/ BCF13MayJuneWEB.pdf

Sorry, the comment form is closed at this time.